Visualizes the output of enrichment_CTD. The function
auto-detects the enrichment method from the input class and column
structure:
ORA / GSEA (data frame with
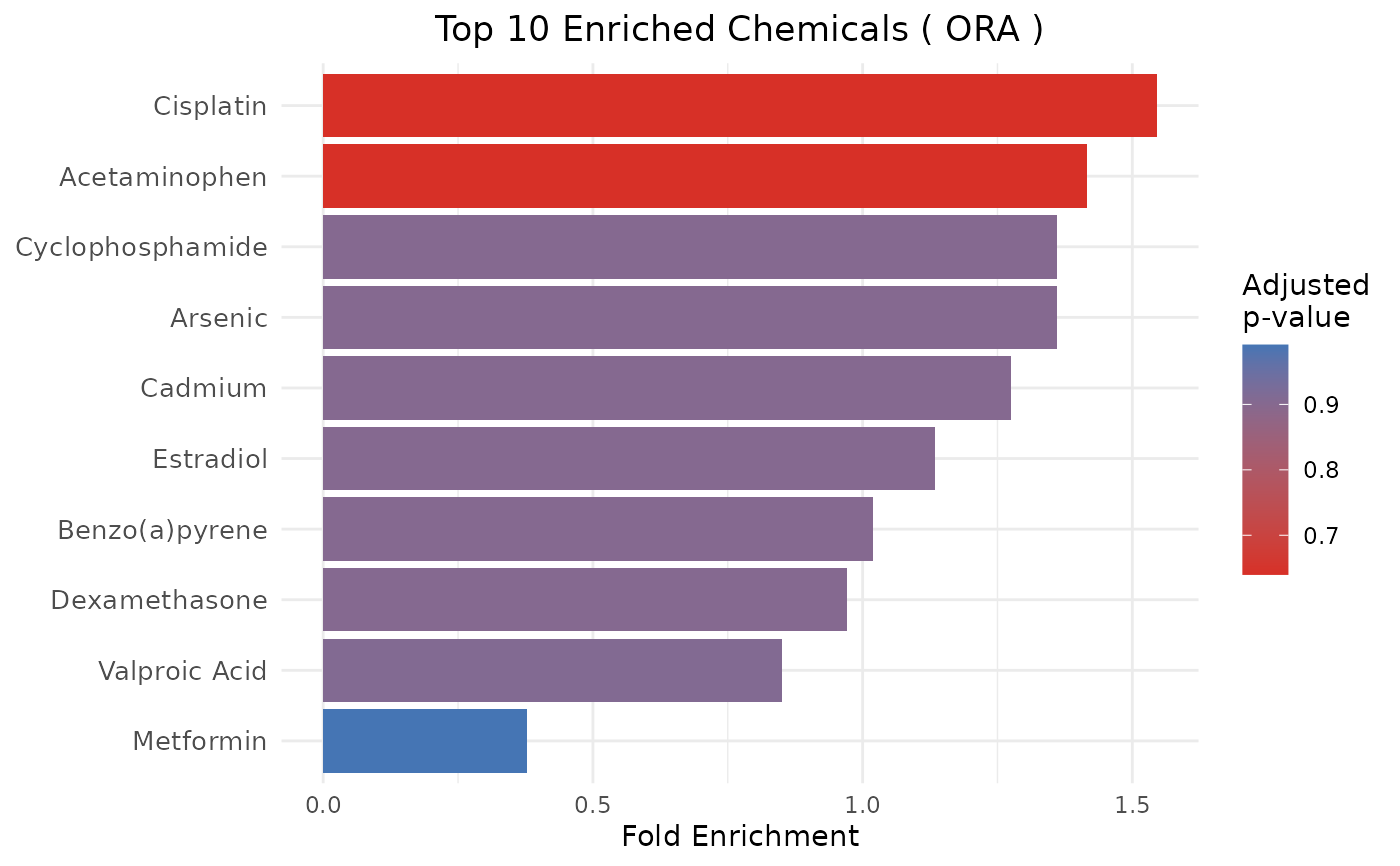
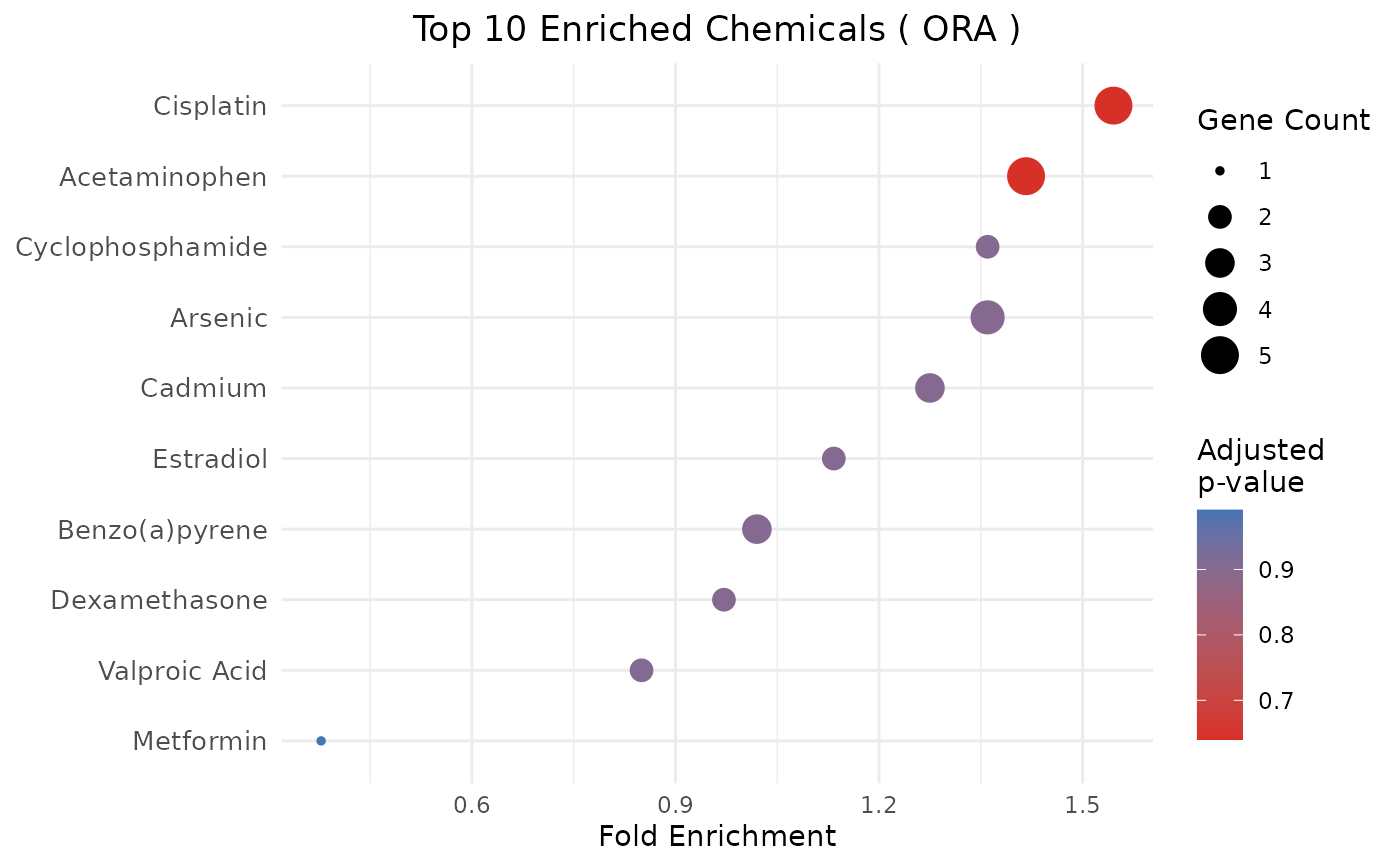
CountorNES): bar or dot plot of fold enrichment.CAMERA (data frame with
DirectionandNGenes): bar or dot plot of \(-\log_{10}(\mathrm{padj})\), colored by direction of enrichment.GSVA (numeric matrix
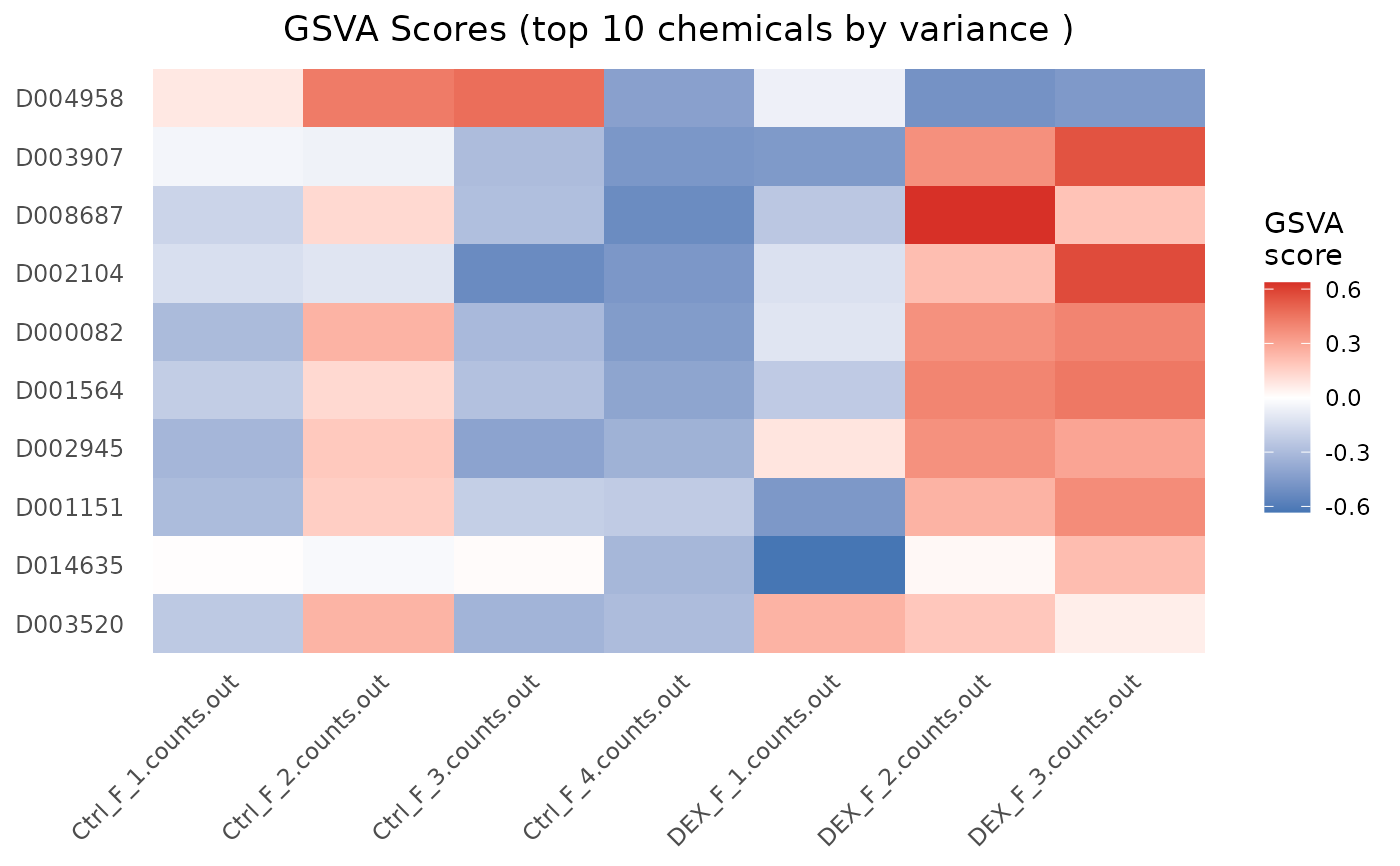
chemicals x samples, or aSummarizedExperimentwrapping one): heatmap of per-sample enrichment scores for the top-N chemicals selected by score variance across samples.
Arguments
- results
A data frame, a numeric matrix, or a
SummarizedExperimentreturned byenrichment_CTD.- type
Character. Plot type for tabular results:
"bar"(default) or"dot". Ignored for GSVA score input.- n
Integer. Number of top chemicals to display (default 20). Selection criterion: ascending
padjfor tabular results, descending score variance across samples for GSVA matrices.- title
Character. Plot title. If
NULL(default), a title is generated automatically based on the detected method.
Examples
# Examples write to a temporary cache, so running them cannot
# disturb CTD data you have already imported. Set the same option
# yourself to keep an analysis isolated from your main cache.
options(ctdR.cache = tempfile())
sample_file <- system.file(
"extdata", "CTD_chem_gene_ixns_sample.csv",
package = "ctdR"
)
import_CTD(sample_file)
#> Reading CTD chemical-gene interactions from: /home/runner/work/_temp/Library/ctdR/extdata/CTD_chem_gene_ixns_sample.csv
#> Filtered to 86 human interactions
#> Mapping genes for 10 chemicals...
#> Warning: 10 ChemicalID(s) appear with more than one ChemicalName in the CTD file; only the first name per ID is retained. Affected IDs: D000082, D001564, D002104, D003907, D004958 ... (and 5 more)
#> CTD data cached successfully in: /tmp/Rtmpt9pODL/file1b134792c3c6
#> 10 chemicals | 17 unique genes | 0 s
#> CTD release: Mon Jan 01 00:00:00 EST 2024
# ORA / GSEA
genes <- data.frame(
EntrezID = c("7124", "3569", "7157", "672", "1956"),
pvalue = c(0.001, 0.003, 0.01, 0.02, 0.05)
)
ora_results <- enrichment_CTD(genes, method = "ORA")
#> background: all 17 genes in the CTD sets, because no 'universe' was given. If your experiment could only detect some of them, pass those as 'universe': a background wider than what was measurable makes p-values too small.
plot_CTD(ora_results, type = "bar")
 plot_CTD(ora_results, type = "dot")
 # GSVA scores: the heatmap accepts either the score matrix or the
# SummarizedExperiment that enrichment_CTD() returns for an SE input.
se <- readRDS(system.file(
"extdata", "GSE311566_subset.rds", package = "ctdR"
))
gsva_scores <- enrichment_CTD(se, method = "GSVA")
#> ℹ No assay name provided; using default assay 'logcounts'
#> ℹ GSVA version 2.6.6
#> ℹ Searching for rows with constant values
#> ℹ Calculating GSVA ranks
#> ℹ kcdf='auto' (default)
#> ℹ GSVA dense (classical) algorithm
#> ℹ Row-wise ECDF estimation with Gaussian kernels
#> ℹ Calculating row ECDFs
#> ℹ Calculating column ranks
#> ℹ GSVA dense (classical) algorithm
#> ℹ Calculating GSVA scores for 10 gene sets
#> ✔ Calculations finished
plot_CTD(gsva_scores)
# GSVA scores: the heatmap accepts either the score matrix or the
# SummarizedExperiment that enrichment_CTD() returns for an SE input.
se <- readRDS(system.file(
"extdata", "GSE311566_subset.rds", package = "ctdR"
))
gsva_scores <- enrichment_CTD(se, method = "GSVA")
#> ℹ No assay name provided; using default assay 'logcounts'
#> ℹ GSVA version 2.6.6
#> ℹ Searching for rows with constant values
#> ℹ Calculating GSVA ranks
#> ℹ kcdf='auto' (default)
#> ℹ GSVA dense (classical) algorithm
#> ℹ Row-wise ECDF estimation with Gaussian kernels
#> ℹ Calculating row ECDFs
#> ℹ Calculating column ranks
#> ℹ GSVA dense (classical) algorithm
#> ℹ Calculating GSVA scores for 10 gene sets
#> ✔ Calculations finished
plot_CTD(gsva_scores)